SAR-2022-023-AD
\newpage
Association between KOOS scores and OTC analgesic use in patients using knee-braces
Document version
| Version | Alterations |
|---|---|
| 01 | Initial version |
Abbreviations
- CI: confidence interval
- KOOS: Knee injury and Osteoarthritis Outcome Score
- OTC: Over the counter
- SD: standard deviation
- VAS: Visual analog scale
Context
Objectives
Quantify the association between KOOS increase and frequency of use of over-the-counter analgesic over a 4-week period, controlling for pain reduction.
Data reception and cleaning
The raw data base was received with KOOS and VAS pain measurements both at baseline and after the 4-week period of the study, as well as the weekly frequency of OTC analgesic use. The original data base had 8 variables collected on 10 observations. From the pre and post measurements available in the raw data the differences between baseline and post KOOS scores were calculated, as well as the differences between baseline and post VAS pain scores. Baseline characteristics were kept for the descriptive analysis of the study sample.
Methods
Study parameters
Study design
Cross-sectional, change from baseline study.
Inclusion and exclusion criteria
N/A
Exposures
Frequency of use of OTC analgesics.
Outcomes
Average increase in KOOS score after a 4-week period using OTC analgesics.
Covariates
VAS pain scale reduction, age and sex.
Statistical analyses
The epidemiological profile of the study participants will be described at baseline. Demographic (sex and age) and clinical variables ( KOOS and VAS scores ) will be described as mean (SD) or as counts and proportions (%), as appropriate. The distributions of participants’ characteristics will be summarized in tables and visualized in exploratory plots.
A multiple linear regression model will be adjusted to the study data to assess the association between the change in KOOS scores and the frequency of use of OTC analgesics, controlling for the change in VAS pain scores. Due to the small sample size available, the results interpretation will focus on the model’s coefficients as a descriptive analysis. Despite this focus on description of possible trends, CI and p-values will be computed and reported for completeness sake.
In order to evaluate the impact of potentially relevant covariates, several models are planned to be specified in increasing complexity. A simple linear regression model will be used to assess the crude estimate of the association between the change in KOOS score and the use of OTC analgesics. Other separate models will add the change in VAS pain score and the demographic covariates (sex and age) as control variables. The final model will include both the change in VAS score and the demographic variables as control variables.
All evaluations will be performed as complete case analyses.
All analyses will be performed using the significance level of 5%.
All significance hypothesis tests and confidence intervals computed will be
This analysis was performed using statistical software R version 4.1.3.
Results
Study population and follow up
Ten participants were followed over the course of a 4-week period in total. Study sample were on average 49 years old at the start of the study, where 70% were women (Table 1). Average KOOS score at baseline was 0.48 and average VAS score was 7.7.
Exploratory plots of age and sex distributions in the study population can be seen in Figures A1 and A2 (Appendix).
Table: Table 1 Demographic and clinical characteristics at baseline.
| Baseline characteristics | N = 10 |
|---|---|
| Sex, n (%) | |
| F | 7 (70%) |
| M | 3 (30%) |
| Age (years), Mean (SD) | 49 (12) |
| VAS score, Mean (SD) | 7.70 (2.31) |
| KOOS score, Mean (SD) | 0.48 (0.14) |
In all participants the KOOS score increased during the observation period (Table 2, Figure 1). Participants showed an average 0.25 increase in KOOS score, with an average 6-point decrease in VAS score. Over the course of four weeks of observation half of the participants made use of OTC analgesics on a weekly basis.
Table: Table 2 Clinical characteristics after 4-weeks of observation.
| Characteristic | N = 10 |
|---|---|
| Change in KOOS score, Mean (SD) | 0.25 (0.14) |
| Change in VAS score, Mean (SD) | -6.10 (1.97) |
| Frequency of use (weekly), n (%) | |
| 0 | 5 (50%) |
| 1 | 5 (50%) |
The distribution of the change in KOOS score is markedly bi-modal (Figure 1), where a single participant showed an atypical increase during the same period – a 26-years old woman exited the study with a 0.58 increase in her KOOS score, having a 6-point decrease in VAS score while taking no weekly OTC analgesics.
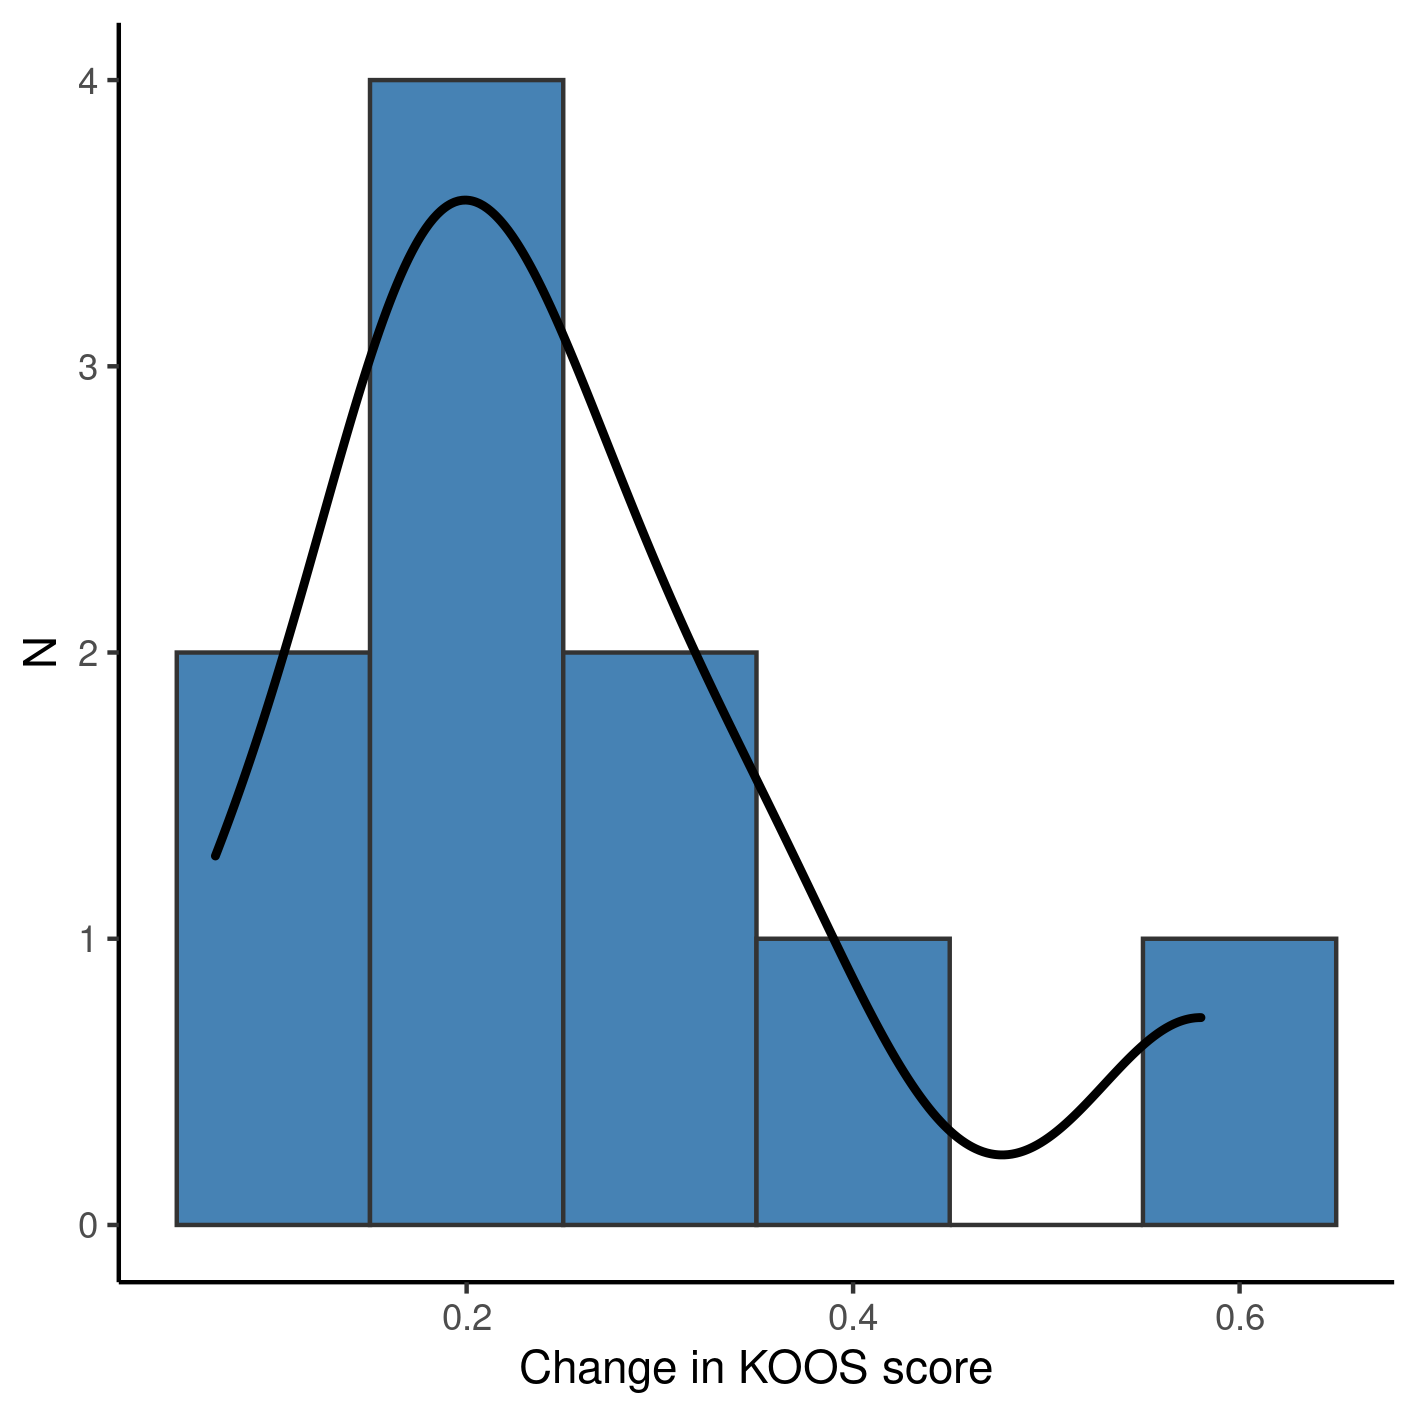
**Figure 1** Change in KOOS score after 4 weeks of observation.
Association between change in KOOS score and use of analgesic
We adjusted four linear models to assess the association of analgesic use on the change in KOOS score (Table 3). Due to the small sample size, none of the models estimated presented significant associations so here we report the trends as a descriptive analysis of the point estimates.
The crude estimate given by a simple linear regression (thus not controlling for other variables) indicates that participants using analgesics on weekly basis had a KOOS score 0.08 lower than participants that did not use analgesics. When controlling for pain reduction as measured by the VAS score this discrepancy increases to a 0.1 decrease, on average. When the association between KOOS and use of analgesics is controlled for the demographic characteristics the difference in KOOS scores is no longer detectable between different analgesic regimens.
Table: Table 3 Linear regressions of change in KOOS score associated with use of over the counter analgesics after 4 weeks of observation using a knee brace.
| Characteristic | Beta | 95% CI | p-value |
|---|---|---|---|
| Crude estimate | -0.08 | -0.29 to 0.13 | 0.420 |
| Controlled for VAS reduction | -0.10 | -0.35 to 0.14 | 0.352 |
| Controlled for sex and age | 0.00 | -0.22 to 0.22 | 0.990 |
| Controlled for VAS reduction, sex and age | -0.05 | -0.26 to 0.16 | 0.557 |
The full model controls for both pain reduction and demographic characteristics, thus giving a more detailed picture of the association. This estimate can be interpreted as participants taking OTC analgesics appearing to have a slightly lower KOOS score after 4 weeks when compared to those who did not take analgesics.
Full details of the models can be seen in Table A1 (Appendix).
Overall, although all participants showed an increase in KOOS scores after four weeks, there does not seem to have evidence of an association of analgesics and a faster improvement.
Observations and Limitations
Risk of bias
Besides bio-mechanical and quality of life measurements the KOOS score also includes qualitative measures of pain. It could be possible that the VAS pain score is correlated with the KOOS score, which would introduce bias in the association being assessed.
Recommended reporting guideline
The adoption of the EQUATOR network (http://www.equator-network.org/) reporting guidelines have seen increasing adoption by scientific journals. All observational studies are recommended to be reported following the STROBE guideline (von Elm et al, 2014).
Conclusions
All participants showed an increase in KOOS scores after four weeks. Despite this overall improvement, there does not seem to have evidence that the use of OTC analgesics is associated with a faster improvement.
References
- SAP-2022-023-AD-v01 – Analytical Plan for Association between KOOS scores and OTC analgesic use in patients using knee-braces
- von Elm E, Altman DG, Egger M, Pocock SJ, Gøtzsche PC, Vandenbroucke JP; STROBE Initiative. The Strengthening the Reporting of Observational Studies in Epidemiology (STROBE) Statement: guidelines for reporting observational studies. Int J Surg. 2014 Dec;12(12):1495-9 (https://doi.org/10.1016/j.ijsu.2014.07.013).
Appendix
Exploratory data analysis
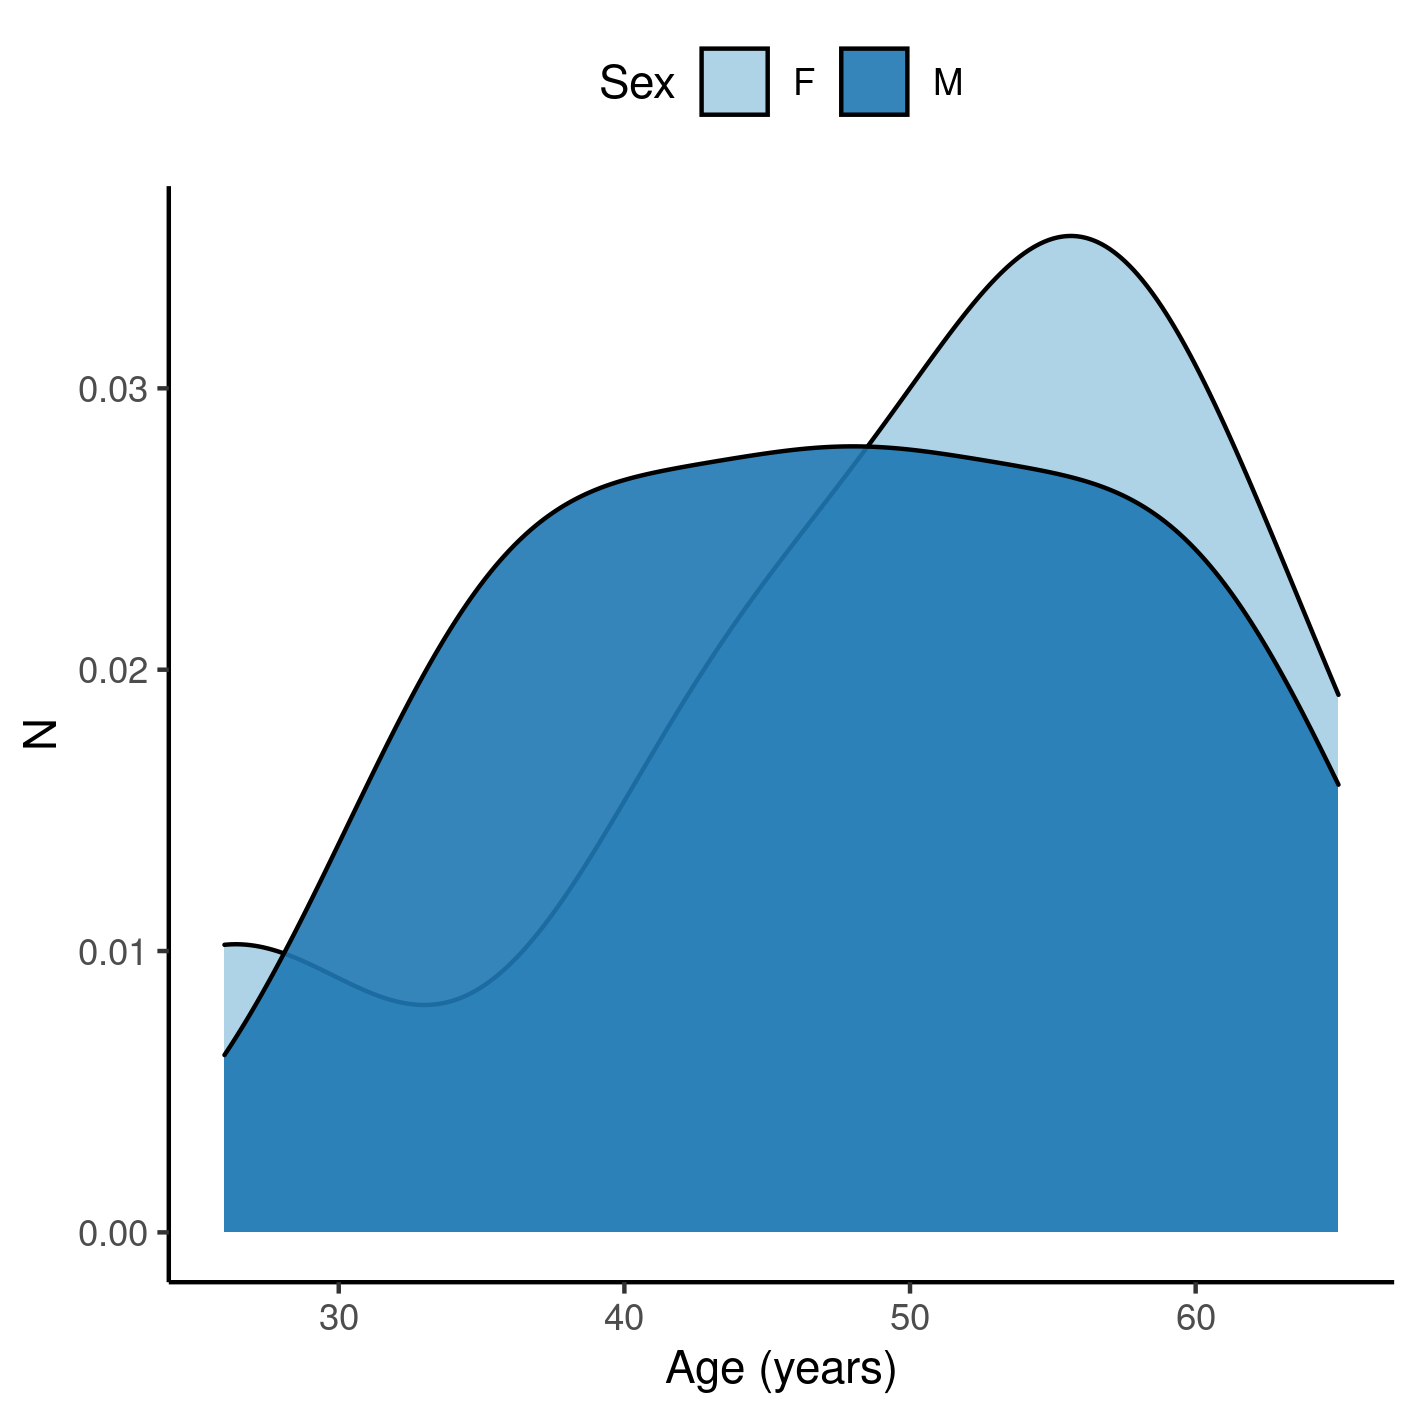
**Figure A1** Distribution of age in the study population.
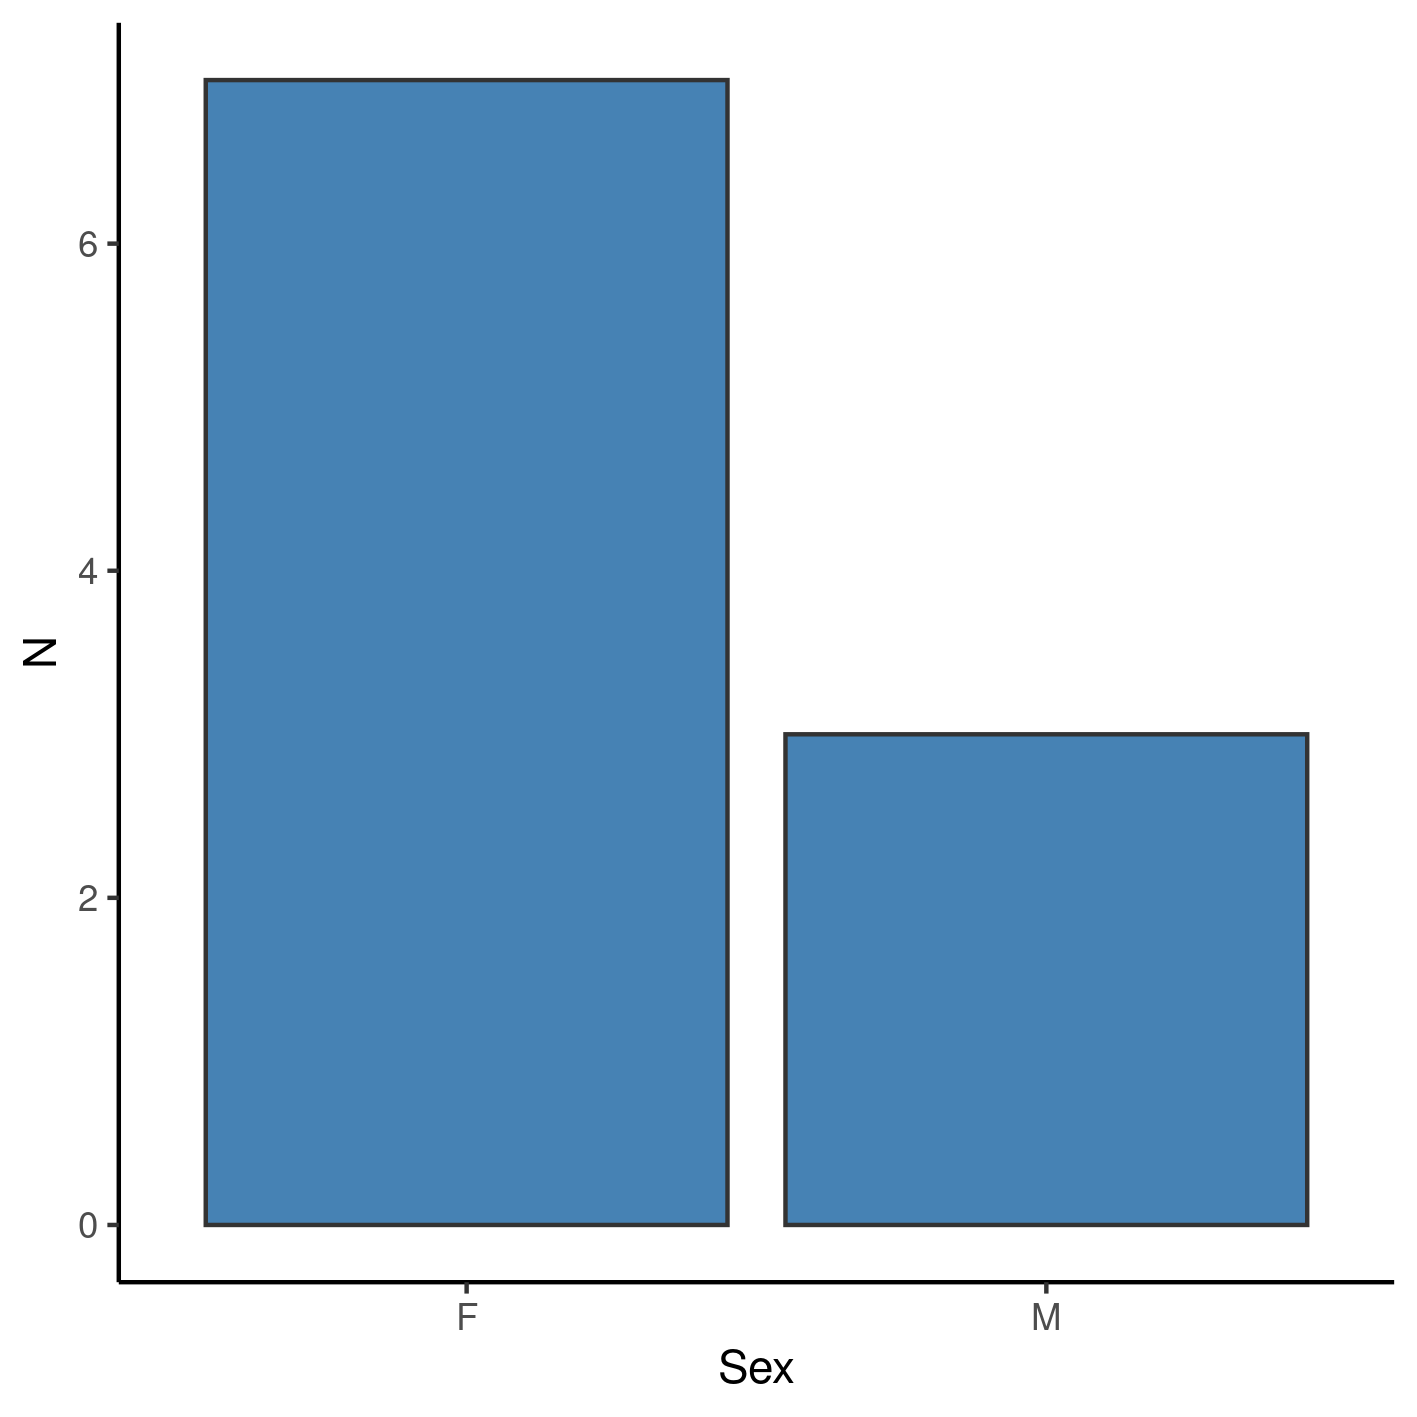
**Figure A2** Distribution of sex in the study population.
Modeling strategy
Demographic characteristics appear to have an impact on the association between KOOS change and use of analgesics. This could indicate that the crude estimate is biased away from the null hypothesis, so controlling for these variables is strongly recommended in future studies with larger sample sizes.
Table: Table A1 Change in KOOS score after 4 weeks of observation.
| Characteristic | Beta | 95% CI | p-value | Beta | 95% CI | p-value | Beta | 95% CI | p-value | Beta | 95% CI | p-value |
|---|---|---|---|---|---|---|---|---|---|---|---|---|
| Frequency of use (weekly) | ||||||||||||
| 0 | — | — | — | — | ||||||||
| 1 | -0.08 | -0.29 to 0.13 | 0.420 | -0.10 | -0.35 to 0.14 | 0.352 | 0.00 | -0.22 to 0.22 | 0.990 | -0.05 | -0.26 to 0.16 | 0.557 |
| Change in VAS score | 0.02 | -0.05 to 0.08 | 0.544 | 0.05 | -0.02 to 0.13 | 0.138 | ||||||
| Sex | ||||||||||||
| F | ||||||||||||
| M | -0.09 | -0.32 to 0.13 | 0.345 | -0.24 | -0.52 to 0.05 | 0.091 | ||||||
| Age (years) | -0.01 | -0.02 to 0.00 | 0.098 | -0.01 | -0.02 to 0.00 | 0.113 |
Availability
All documents from this consultation were included in the consultant’s Portfolio.
The portfolio is available at:
https://philsf-biostat.github.io/SAR-2022-023-AD/
Analytical dataset
Table A2 shows the structure of the analytical dataset.
| id | age | sex | pain_pre | koos_pre | outcome | pain_reduc | frequency |
|---|---|---|---|---|---|---|---|
| 1 | |||||||
| 2 | |||||||
| 3 | |||||||
| … | |||||||
| N |
Table: Table A2 Analytical dataset structure
Due to confidentiality the data-set used in this analysis cannot be shared online in the public version of this report.