SAR-2023-016-BH
\newpage
Time-adjusted effect of socioeconomic status in mortality rates after brain injury: cohort study
Document version
| Version | Alterations |
|---|---|
| 01 | Initial version |
Abbreviations
- FIM: Functional Independence Measure
- HR: hazards ratio
- SD: standard deviation
- SES: socioeconomic status
Context
This analysis expands on a previous analysis with a similar objective (SAR-2023-004-BH-v02), by employing more flexible modeling strategies to include time-dependent covariates that were dropped from the previous analysis. In the process the raw FIM scores were substituted by their quartiles.
Objectives
To determine the effect of socioeconomic status of the neighborhood on mortality of patients with brain injury, accounting for time-dependent covariates.
Methods
The data procedures, design and analysis methods used in this report are fully described in the annex document SAP-2023-016-BH-v01.
This analysis was performed using statistical software R version 4.3.2.
Results
Study population and follow up
There initially were 76,665 observations on 19,303 study participants considered for inclusion. After excluding follow up measurements during the COVID-19 pandemic to mitigate confounding on mortality causes there were 69,440 observations left in the study sample. After applying the inclusion criteria for the study period between 2010-01-01 and 2018-12-31 and considering the status at the last available follow up time for each individual a total of 7,415 participants were included in the analysis.
The epidemiological profile of the participant included in the study was a male participant (5,421 (73%)) with an average (SD) age of 45 (20) years.
Races were not homogeneously available in the study population with 4,941 (67%) individuals being white; 3,170 (43%) were single (never married) at the time of injury, and most participants were well educated with 3,366 (46%) at greater than high school level. A total of 4,378 (59%) were employed and 3,465 (48%) participants lived in an urban area.
Table: Table 1 Epidemiological, demographic and clinical characteristics of study participants at the time of discharge.
| Characteristic | N = 7,415 |
|---|---|
| SES quintiles, n (%) | |
| Prosperous | 1,353 (22%) |
| Comfortable | 1,239 (20%) |
| Mid-Tier | 1,124 (18%) |
| At-Risk | 1,168 (19%) |
| Distressed | 1,194 (20%) |
| Missing | 1,337 |
| Sex:, n (%) | |
| Male | 5,421 (73%) |
| Female | 1,988 (27%) |
| Missing | 6 |
| What is your race?, n (%) | |
| White | 4,941 (67%) |
| Black | 1,144 (15%) |
| Hispanic | 952 (13%) |
| Other | 368 (5.0%) |
| Missing | 10 |
| What is your marital status?, n (%) | |
| Single (Never Married) | 3,170 (43%) |
| Married | 2,595 (35%) |
| Divorced | 921 (12%) |
| Separated | 244 (3.3%) |
| Widowed | 454 (6.1%) |
| Other | 15 (0.2%) |
| Missing | 16 |
| Age at Injury, Mean (SD) | 45 (20) |
| Missing | 19 |
| Substance Problem Use, n (%) | 2,691 (38%) |
| Missing | 264 |
| Education, n (%) | |
| Greater Than High School | 3,366 (46%) |
| Less Than High School | 1,380 (19%) |
| High School/GED | 2,615 (36%) |
| Missing | 54 |
| At time of injury, what was your employment status?, n (%) | |
| Employed | 4,378 (59%) |
| Unemployed | 794 (11%) |
| Other | 2,209 (30%) |
| Missing | 34 |
| Urbanization based on zip code of address at discharge., n (%) | |
| Suburban | 2,192 (30%) |
| Rural | 1,635 (22%) |
| Urban | 3,465 (48%) |
| Missing | 123 |
| Prior to this injury, has a physician ever told you that you have a seizure disorder?, n (%) | 52 (5.6%) |
| Missing | 6,488 |
| Spinal cord injury:, n (%) | 434 (5.9%) |
| Missing | 19 |
| Cause of injury:, n (%) | |
| Vehicular | 3,327 (45%) |
| Violence | 650 (8.8%) |
| Falls | 2,544 (34%) |
| Other | 873 (12%) |
| Missing | 21 |
| Primary rehabilitation payor:, n (%) | |
| Private Insurance | 3,871 (52%) |
| Public Insurance | 2,917 (39%) |
| Other | 600 (8.1%) |
| Missing | 27 |
| Residence after rehab discharge:, n (%) | |
| Private Residence | 5,857 (79%) |
| Other | 1,537 (21%) |
| Missing | 21 |
| Days From Injury to Rehab Discharge, Mean (SD) | 46 (37) |
| FIM Motor at Discharge quartiles, n (%) | |
| Q1 | 1,856 (25%) |
| Q2 | 2,001 (27%) |
| Q3 | 1,704 (23%) |
| Q4 | 1,747 (24%) |
| Missing | 107 |
| FIM Cognitive at Discharge quartiles, n (%) | |
| Q1 | 1,943 (26%) |
| Q2 | 1,885 (26%) |
| Q3 | 1,827 (25%) |
| Q4 | 1,726 (23%) |
| Missing | 34 |
| What is your marital status?, n (%) | |
| Single | 3,170 (43%) |
| Married | 2,595 (35%) |
| Sep | 1,165 (16%) |
| Other | 469 (6.3%) |
| Missing | 16 |
| What is your marital status?, n (%) | |
| Single (Never Married) | 3,170 (43%) |
| Married | 2,595 (35%) |
| Other | 1,634 (22%) |
| Missing | 16 |
The observed overall mortality was 13.5% in the study period. The distribution of cases appear homogeneous across SES quintiles (Figure 1), ranging from 10.6% to 13.5%. We will test the effect of SES quintiles on the hazard rate in the next section. See also Figure A2 in the appendix for the distribution of sexes in each SES quintile in the study population.
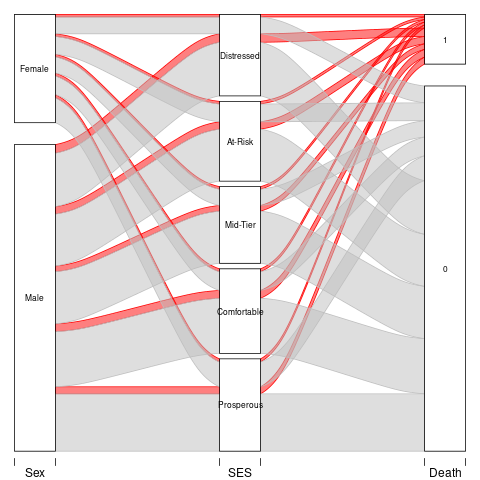
**Figure 1** Proportion of cases per SES quintiles.
Time-adjusted effect of SES on mortality
Following the findings of SAR-2023-017-BH-v01 the multiple observations per individual should be favored where the time-varying SES exposure allows the full model specification in this analytical plan to be used. This analysis, however includes an additional model with interactions between the two FIM scores and the exposure that renders those findings obsolete, given that with this new specification all terms satisfy the proportional hazards assumption. This is the model that will be described in this section.
The previous seizure disorder diagnosis was missing for most of the study population and was not included in the model as a covariate to preserve study power. After excluding participants with missing data from other variables a total of 5,755 complete cases were available for analysis. The cause of injury was removed from the model due to violations of the proportional hazards assumption (see section 8.2.1.1.3 in the appendix).
The survival curves of both sexes by SES quintiles can be seen in Figure 2. Overall, the distressed neighborhoods appear to have a lower survival probability then other neighborhoods. This appears to be true for both sexes, and males had a higher risk of dying than females in all neighborhoods. This plot was cropped at 50% survival for presentation purposes, see Figure A3 in the appendix for an uncropped version.
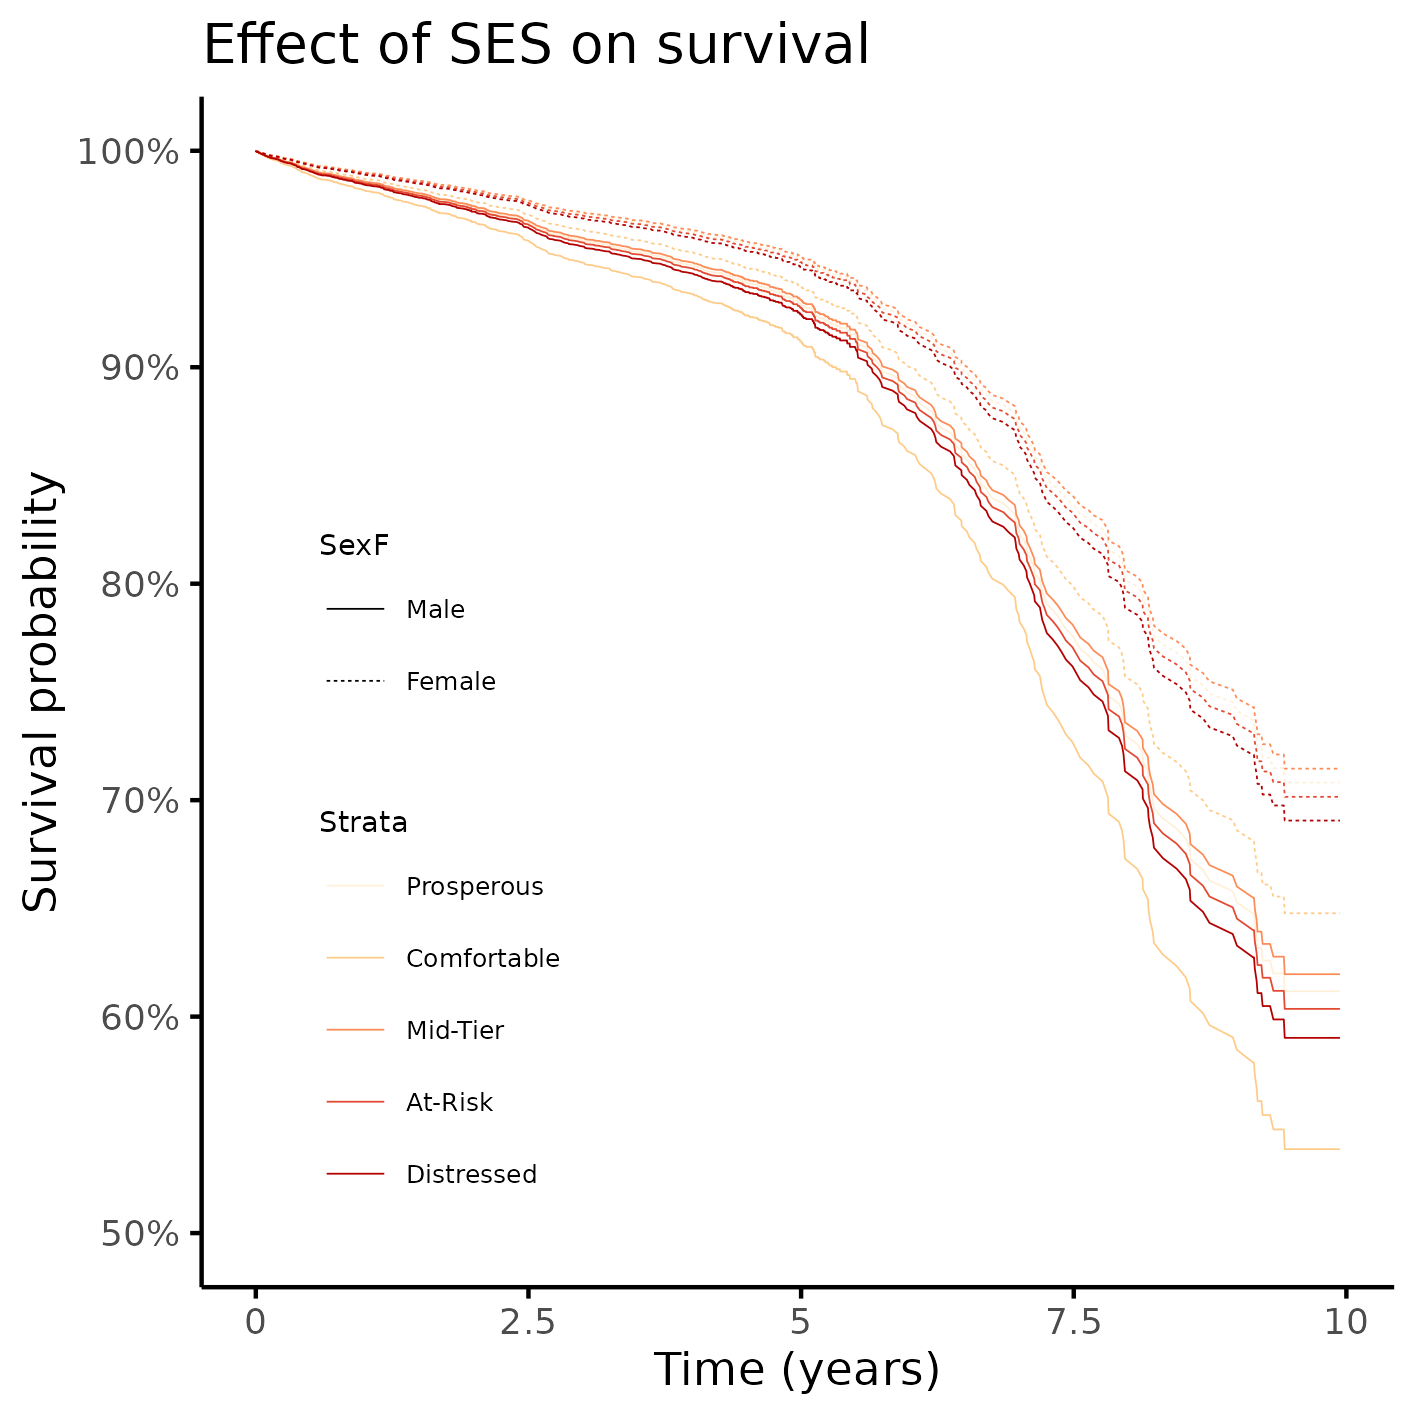
**Figure 2** Survival of participants, by sex and by SES quintiles.
The effect of SES of the neighborhood to which the individuals were discharged was associated with mortality and it was modified by the FIM Motor at Discharge quartiles (Table 2). No level of FIM motor function appears to be protective, but participants with the highest functional scores (within the fourth quartile) had a significant increased risk of dying in all neighborhoods, compared to the prosperous neighborhoods.
Table: Table 2 Effect of SES on mortality; HR estimates were adjusted for sex, race, age, education, employment status, residence after rehab discharge, urbanization, rehabilitation payer, spinal cord injury, substance abuse, days from injury to rehab, FIM scores quartiles and interactions between FIM scores and the exposure.
| Characteristic | HR | 95% CI | p-value |
|---|---|---|---|
| SES quintiles | |||
| Prosperous | — | — | |
| Comfortable | 0.78 | 0.51 to 1.20 | 0.260 |
| Mid-Tier | 0.67 | 0.42 to 1.08 | 0.097 |
| At-Risk | 0.82 | 0.53 to 1.27 | 0.365 |
| Distressed | 1.04 | 0.69 to 1.57 | 0.841 |
| SES quintiles * FIM Motor at Discharge quartiles | |||
| Comfortable * Q2 | 1.53 | 0.84 to 2.77 | 0.163 |
| Mid-Tier * Q2 | 1.39 | 0.73 to 2.65 | 0.323 |
| At-Risk * Q2 | 1.20 | 0.67 to 2.16 | 0.546 |
| Distressed * Q2 | 0.98 | 0.54 to 1.78 | 0.954 |
| Comfortable * Q3 | 1.05 | 0.51 to 2.16 | 0.884 |
| Mid-Tier * Q3 | 1.15 | 0.56 to 2.39 | 0.706 |
| At-Risk * Q3 | 1.09 | 0.54 to 2.20 | 0.807 |
| Distressed * Q3 | 1.05 | 0.54 to 2.04 | 0.878 |
| Comfortable * Q4 | 5.19 | 2.08 to 13.0 | <0.001 |
| Mid-Tier * Q4 | 3.59 | 1.37 to 9.38 | 0.009 |
| At-Risk * Q4 | 3.41 | 1.34 to 8.64 | 0.010 |
| Distressed * Q4 | 5.11 | 2.06 to 12.7 | <0.001 |
| SES quintiles * FIM Cognitive at Discharge quartiles | |||
| Comfortable * Q2 | 0.97 | 0.52 to 1.82 | 0.921 |
| Mid-Tier * Q2 | 1.23 | 0.63 to 2.42 | 0.540 |
| At-Risk * Q2 | 0.86 | 0.46 to 1.62 | 0.634 |
| Distressed * Q2 | 0.79 | 0.43 to 1.46 | 0.448 |
| Comfortable * Q3 | 0.81 | 0.40 to 1.65 | 0.564 |
| Mid-Tier * Q3 | 2.12 | 1.02 to 4.41 | 0.043 |
| At-Risk * Q3 | 1.30 | 0.67 to 2.54 | 0.444 |
| Distressed * Q3 | 1.05 | 0.53 to 2.04 | 0.896 |
| Comfortable * Q4 | 0.76 | 0.36 to 1.60 | 0.468 |
| Mid-Tier * Q4 | 0.90 | 0.39 to 2.08 | 0.809 |
| At-Risk * Q4 | 1.88 | 0.89 to 3.99 | 0.100 |
| Distressed * Q4 | 0.93 | 0.44 to 1.97 | 0.845 |
Additionally it appears that the risk of dying associated with the DCI in neighborhoods has a “U-shape”, where “comfortable” and “distressed” locations show a higher incidence than both “mid-tier” and “at-risk” locations. This might indicate a more complex non-linear relationship between SES and FIM scores that could be evaluated in future studies.
Observations and Limitations
Recommended reporting guideline
The adoption of the EQUATOR network (http://www.equator-network.org/) reporting guidelines have seen increasing adoption by scientific journals. All observational studies are recommended to be reported following the STROBE guideline (von Elm et al, 2014).
Conclusions
The epidemiological profile of the study participant is a 31 years old white male, that has greater than high school level of education, is actively employed and lives in an urban setting.
After controlling for demographic, geographical, clinical variables and FIM scores SES is associated with an increased incidence of mortality when participants also have higher levels of motor function. This association holds regardless of what neighborhood participants were discharged to.
References
- SAP-2023-016-BH-v03 – Analytical Plan for Time-adjusted effect of socioeconomic status in mortality rates after brain injury: cohort study
- SAR-2023-017-BH-v01 – Sensitivity of mortality rates to the imputation of missing socioeconomic data: cohort study
- SAR-2023-004-BH-v02 – Effect of socioeconomic status in mortality rates after brain injury: cohort study
- von Elm E, Altman DG, Egger M, Pocock SJ, Gøtzsche PC, Vandenbroucke JP; STROBE Initiative. The Strengthening the Reporting of Observational Studies in Epidemiology (STROBE) Statement: guidelines for reporting observational studies. Int J Surg. 2014 Dec;12(12):1495-9 (https://doi.org/10.1016/j.ijsu.2014.07.013).
Appendix
Exploratory data analysis
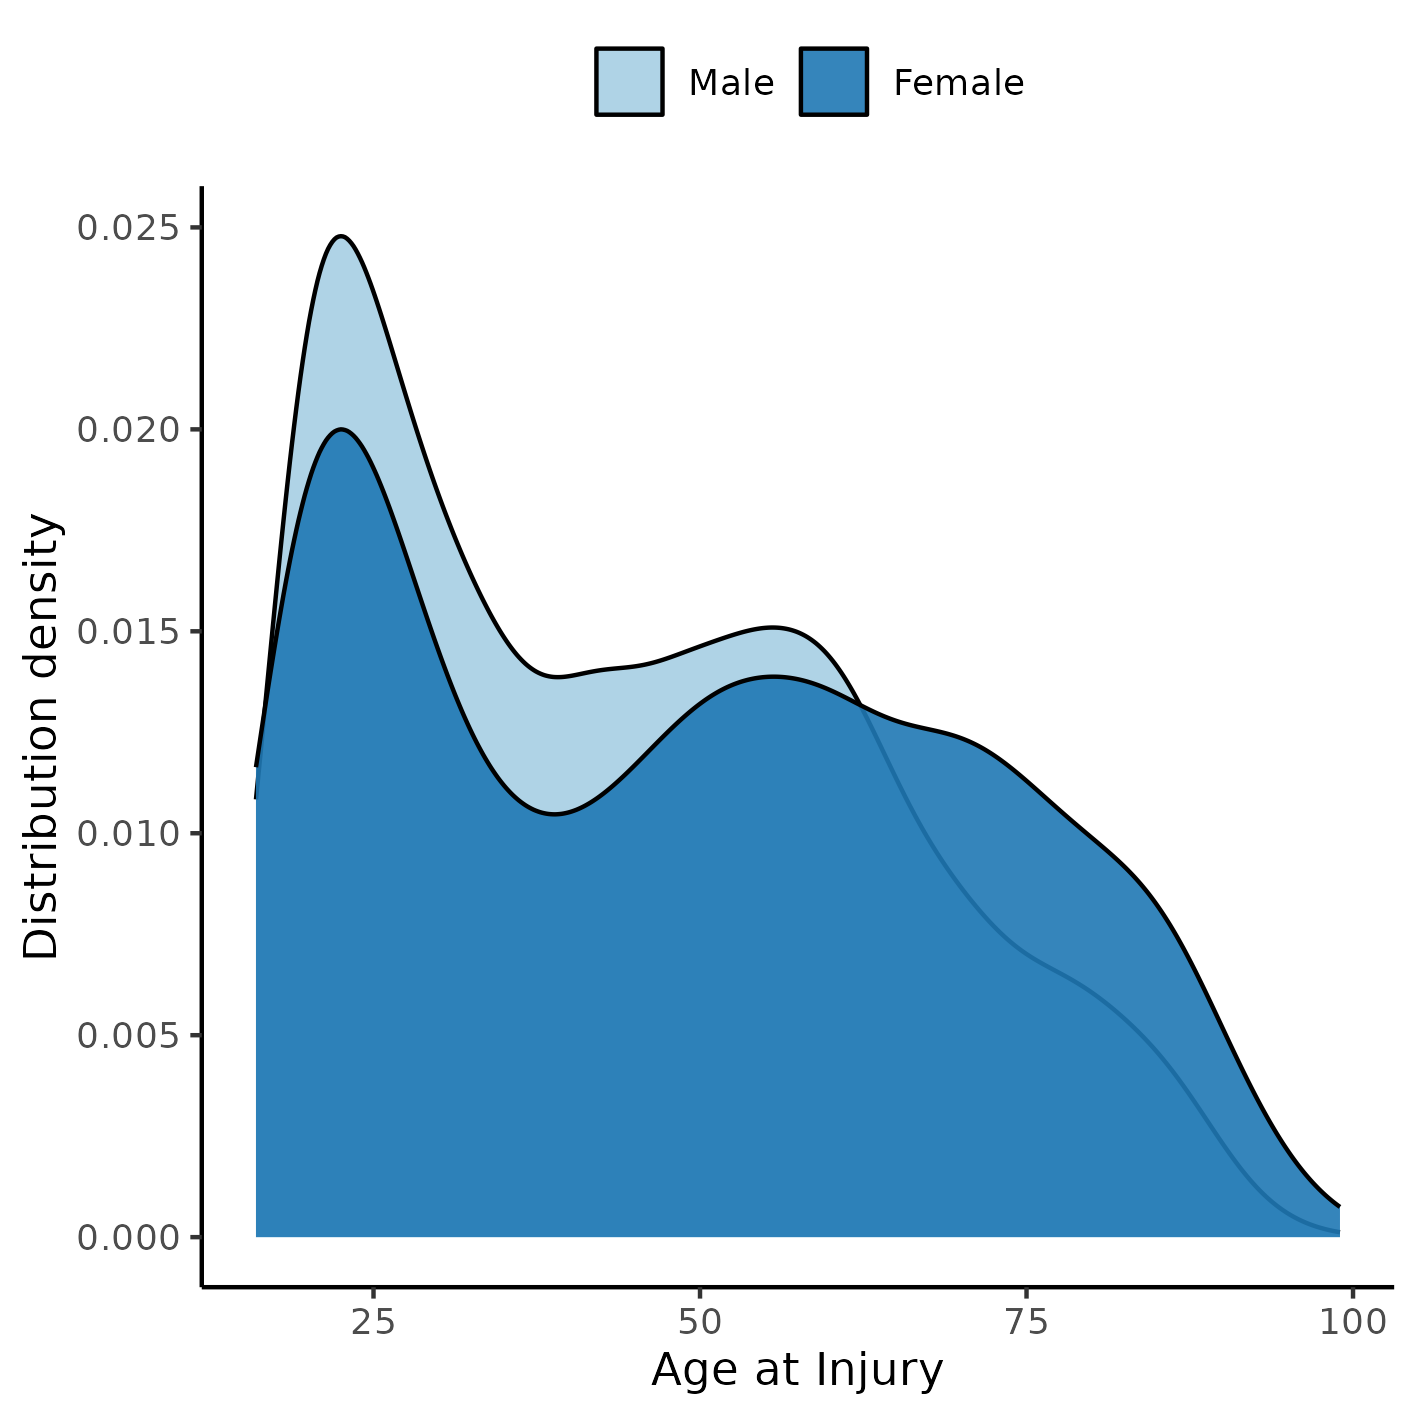
**Figure A1** Distribution of age in the study population.
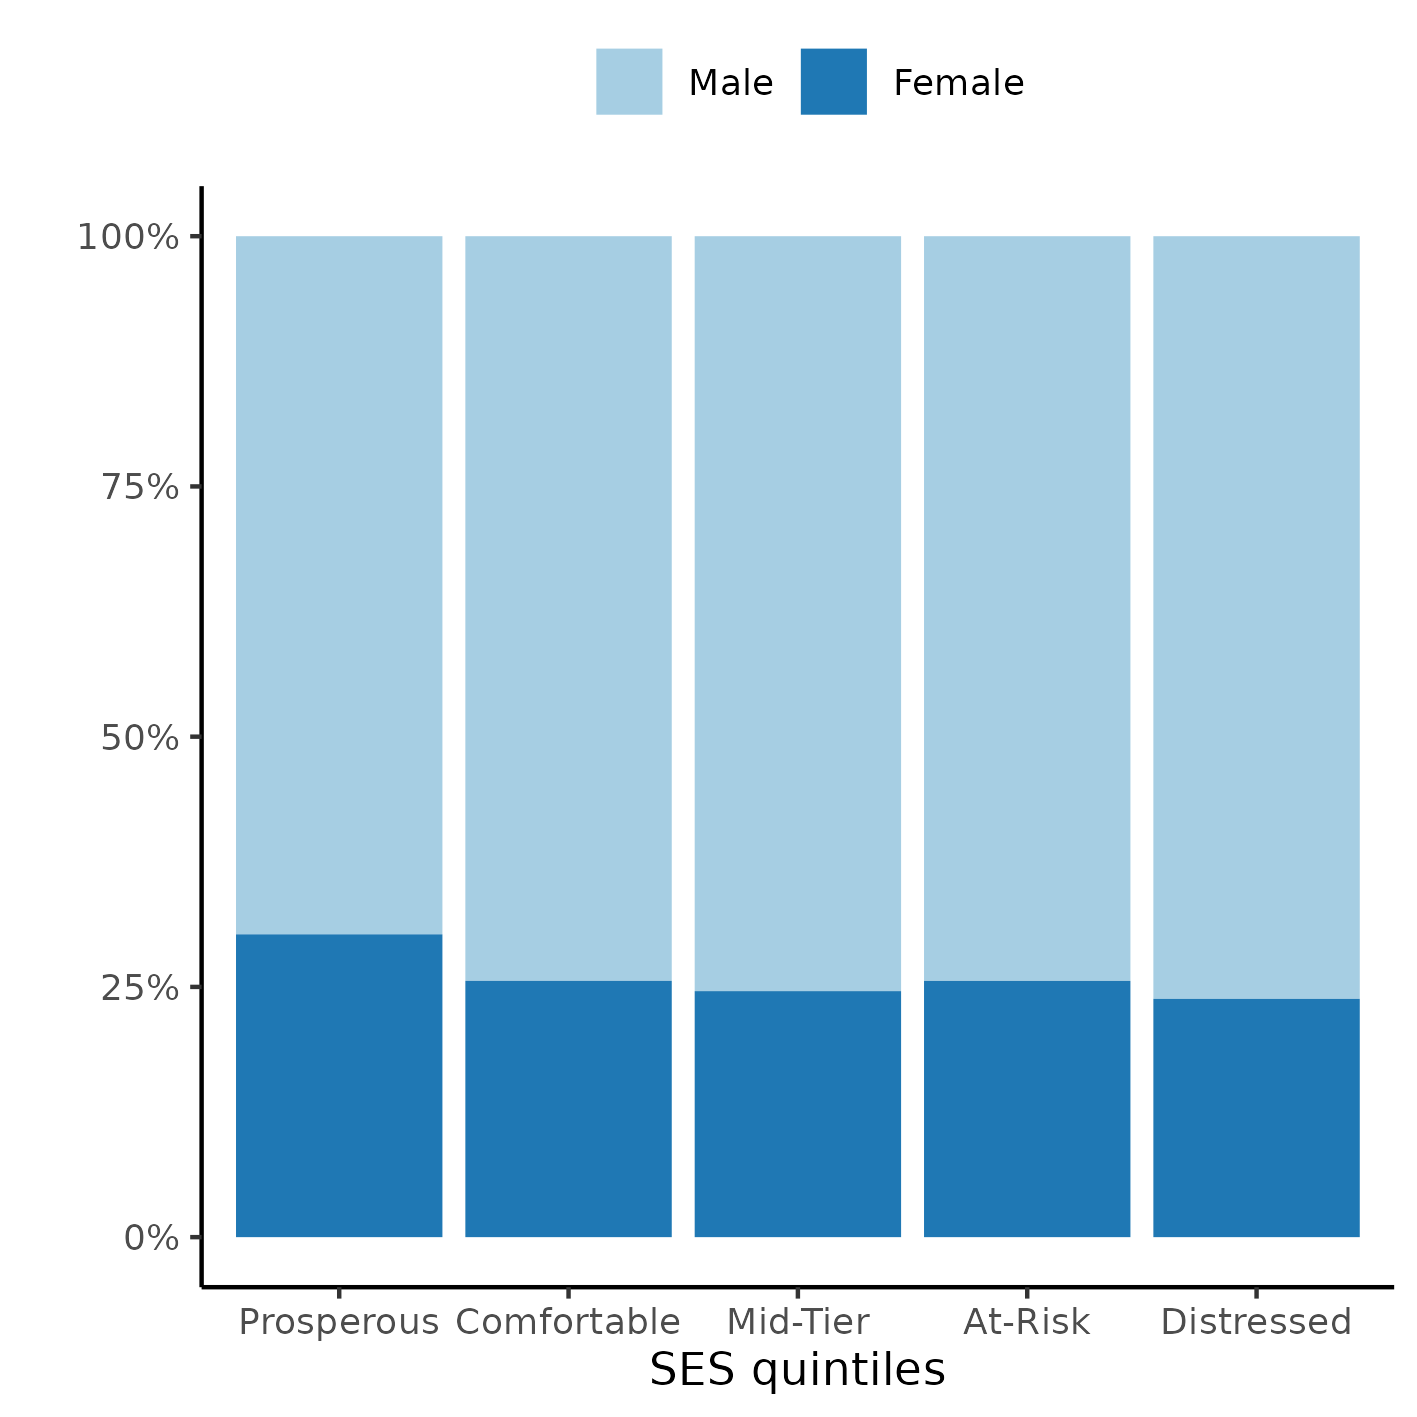
**Figure A2** Distribution of SES in the study population.
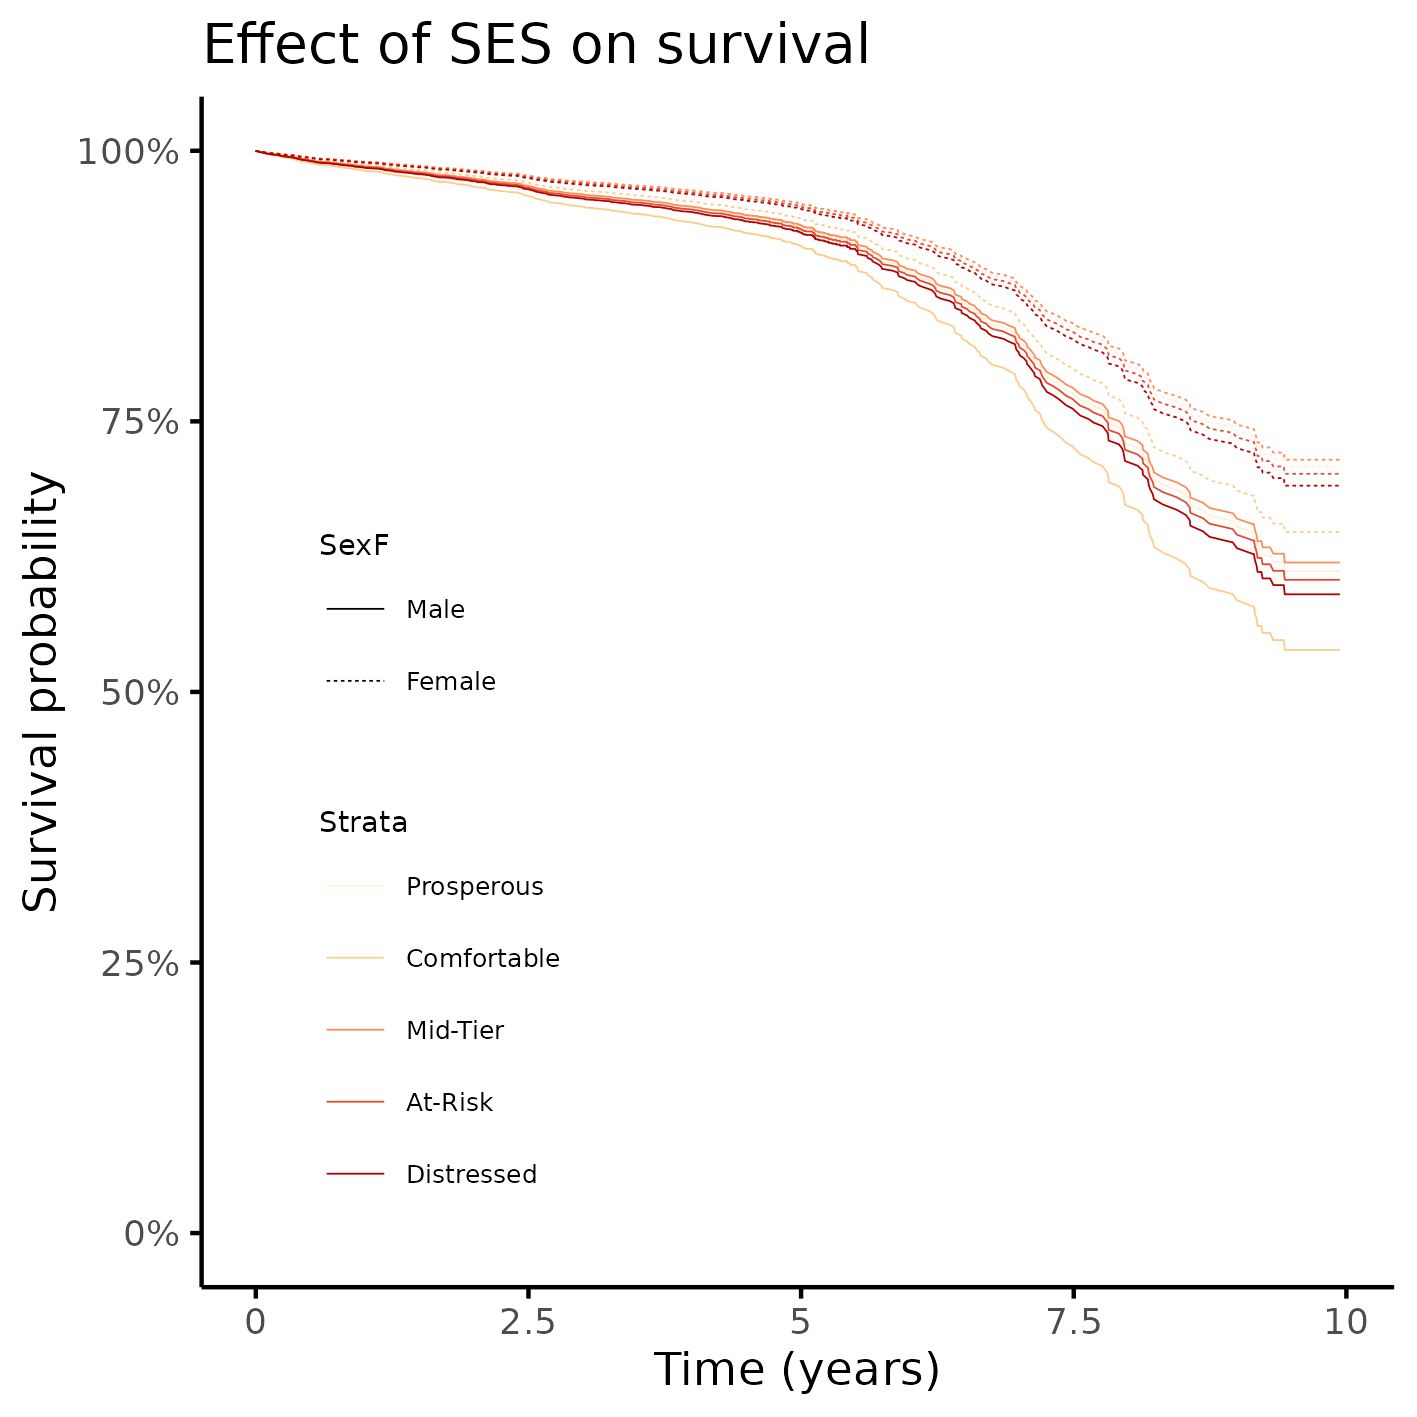
**Figure A3** Alternative version of figure 2.
Modeling strategy
Approaches to control for time-dependent covariates
Before location/SES imputation
Imputation was done in a separate analysis and is described in the report SAR-2023-017-v01.
Schoenfeld and Martingale residuals
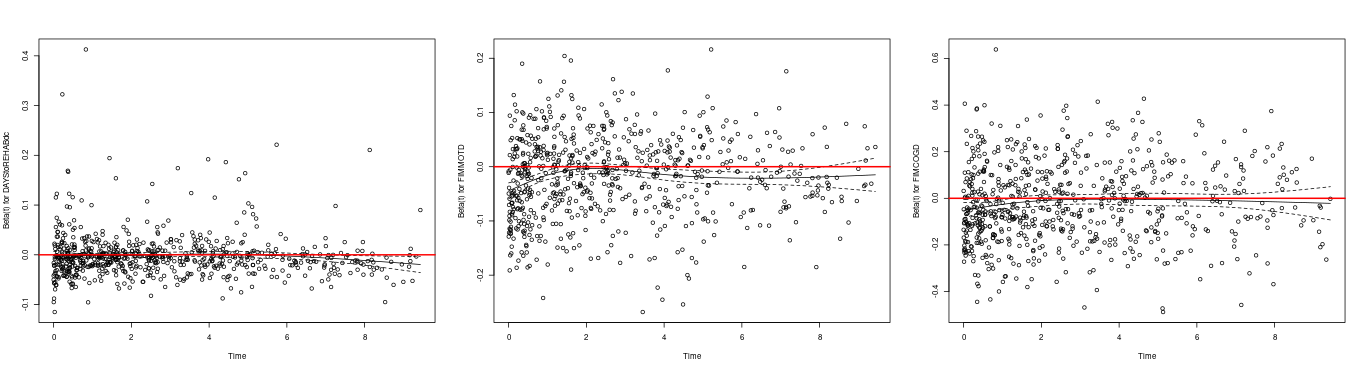
**Figure A4** caption
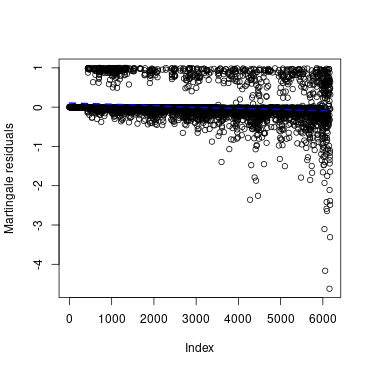
**Figure A5** caption
Notes:
- cause, days, fimmot and fimcog are time-dependent (fail schoenfeld test) (A4)
- a few observations might be outliers, but do not appear to be influential (A5)
Martingale residuals of covariates against the null model
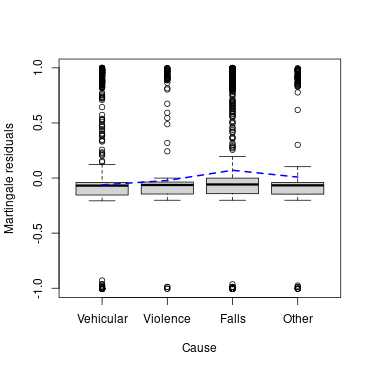
**Figure A6** caption
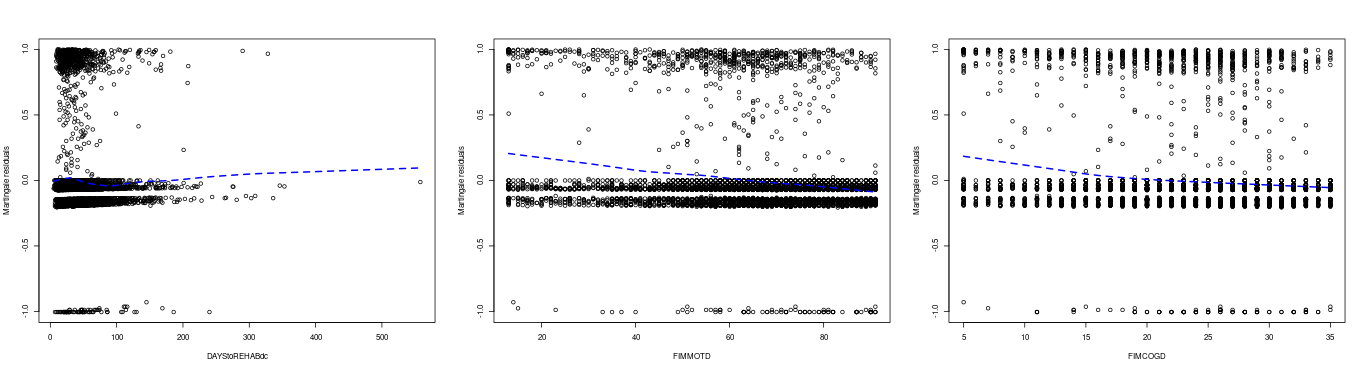
**Figure A7** caption
Notes:
- Cause has an extreme non-PH violation, falls are much higher risk (A6)
- this justifies stratifying by Cause
- individuals with lower days/fimmot/fimcog have higher non-PH risk (A7)
- days is much worse than FIM scores (highly non-linear) (A7)
Stratification by cause of injury
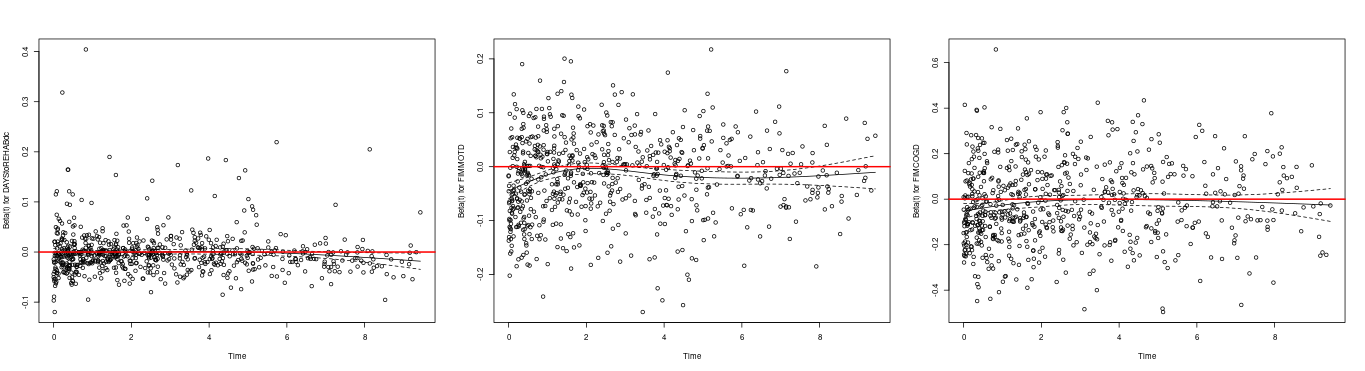
**Figure A8** caption
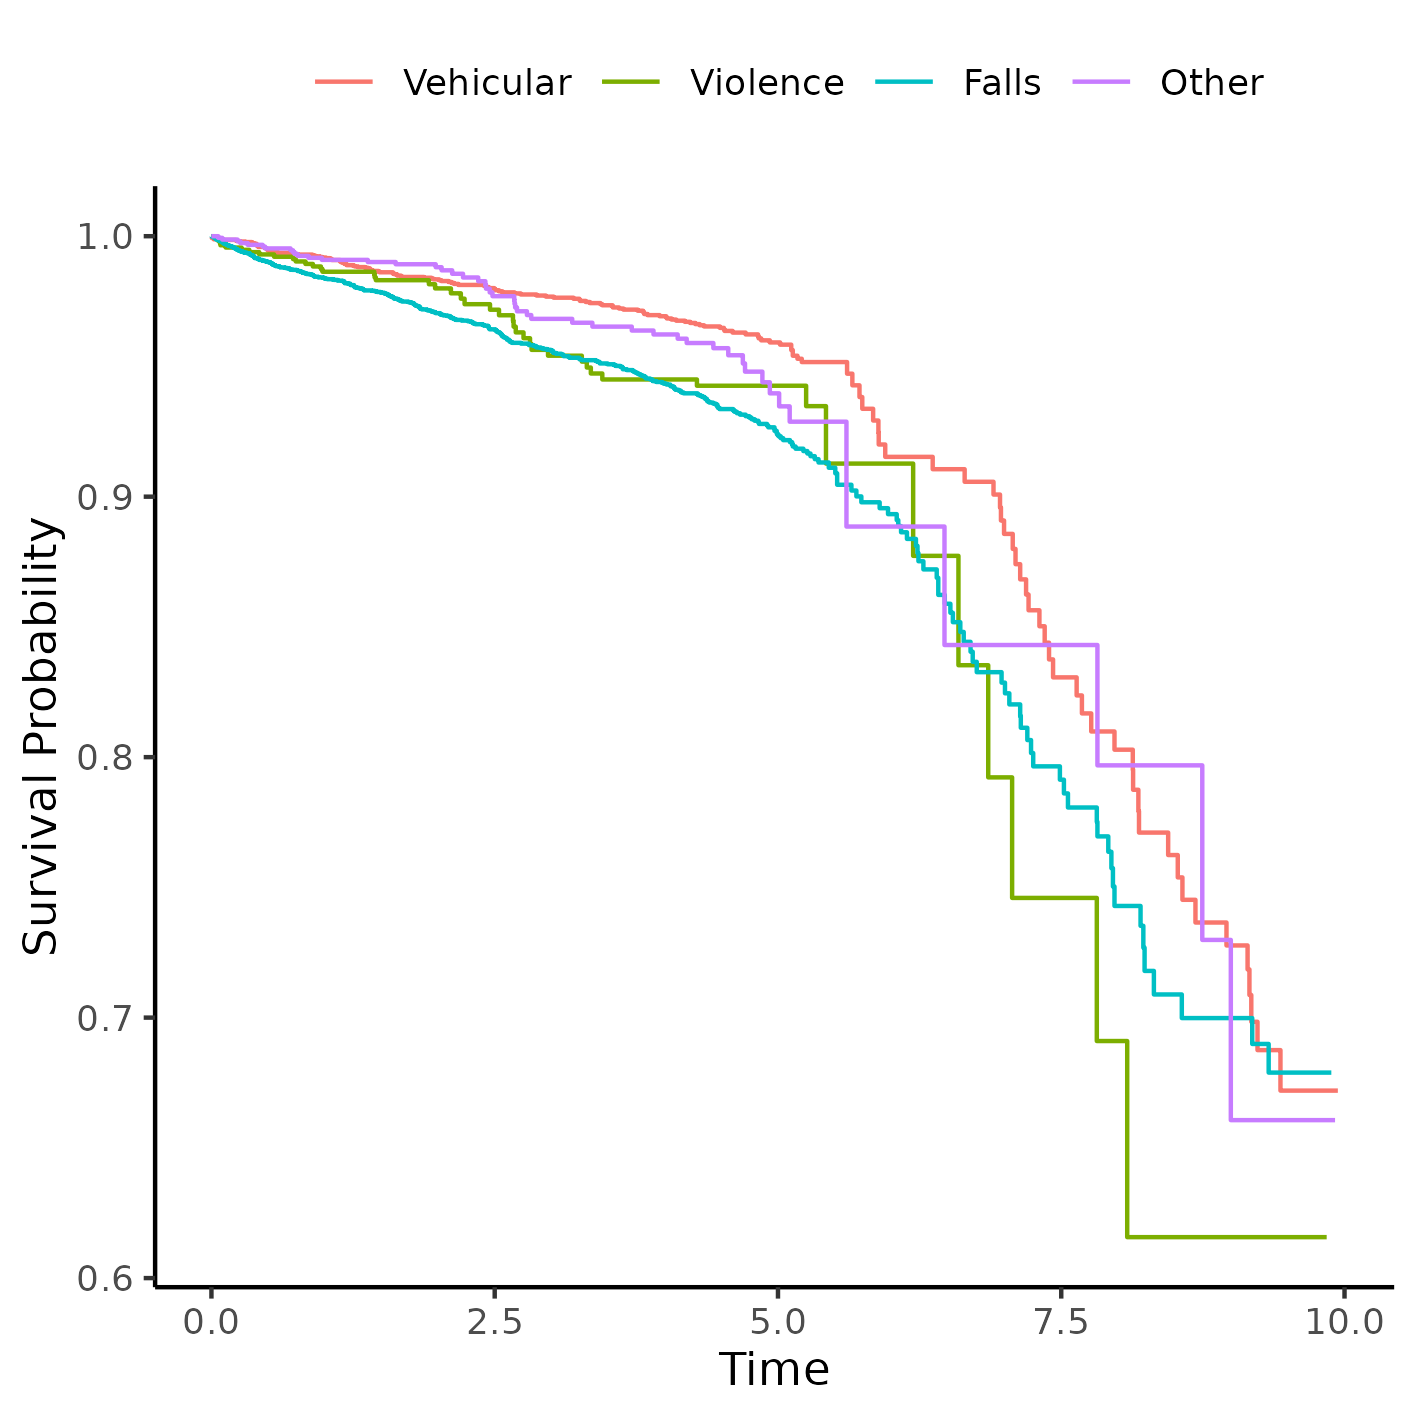
**Figure A9** caption
Notes:
- stratifying by cause appears to help with non-PH of the 3 vars (A8)
- cause violates the PH assumption (A9)
Time split
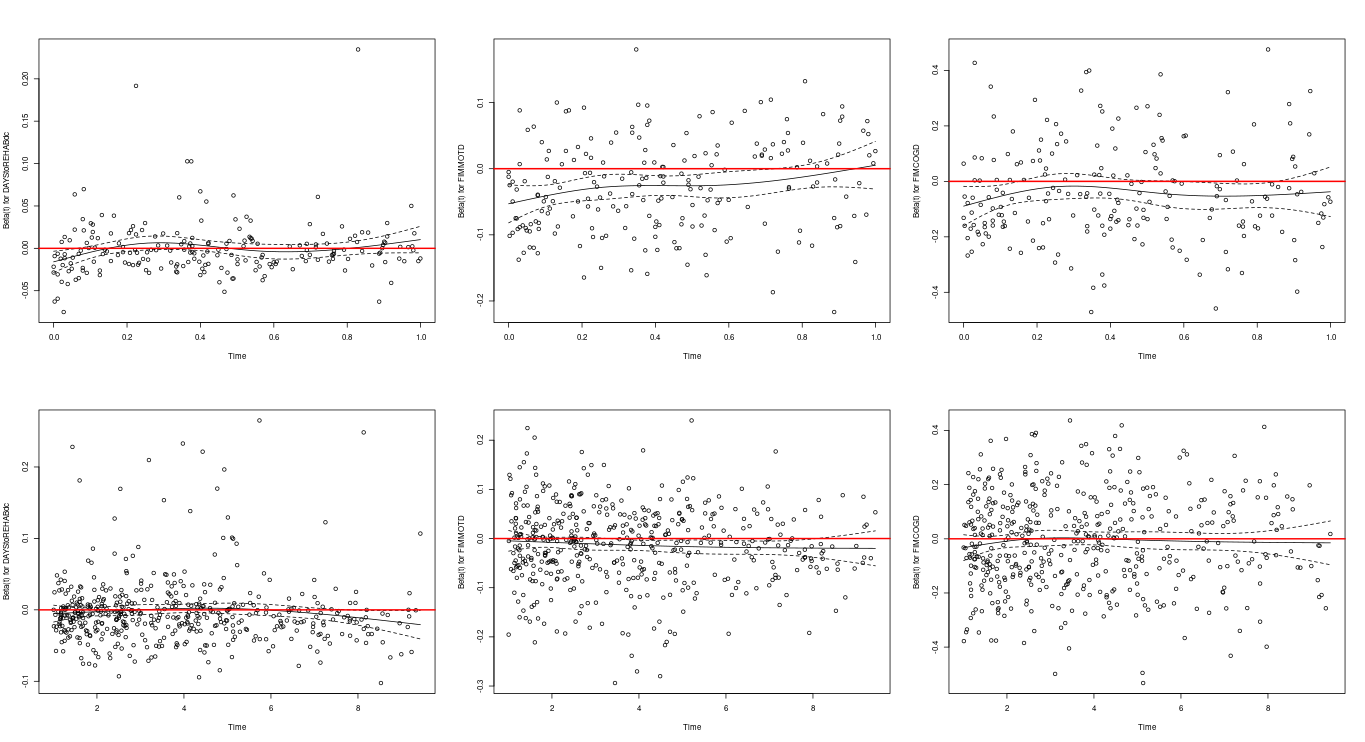
**Figure A10** caption
Notes:
- time split at 1yr doesn’t help further (A10)
Non-linear fitting
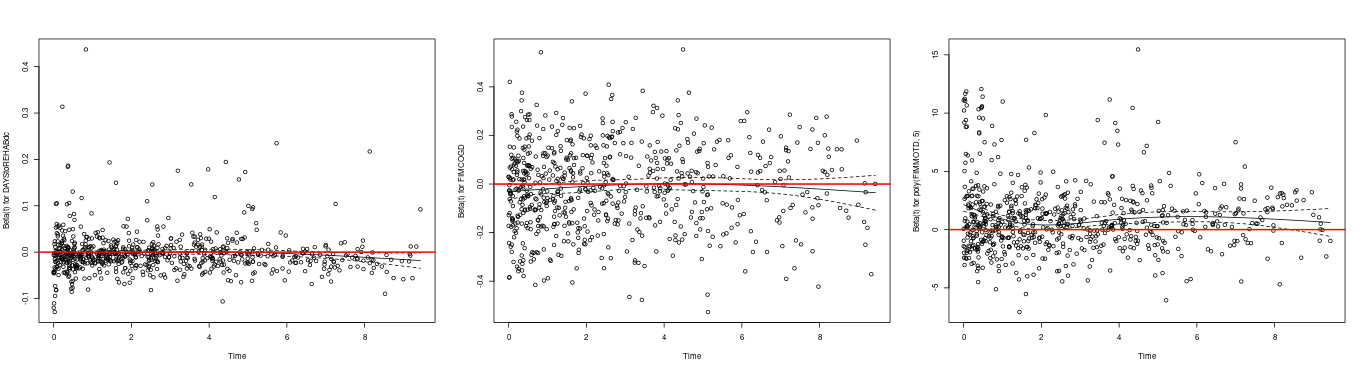
**Figure A11** caption
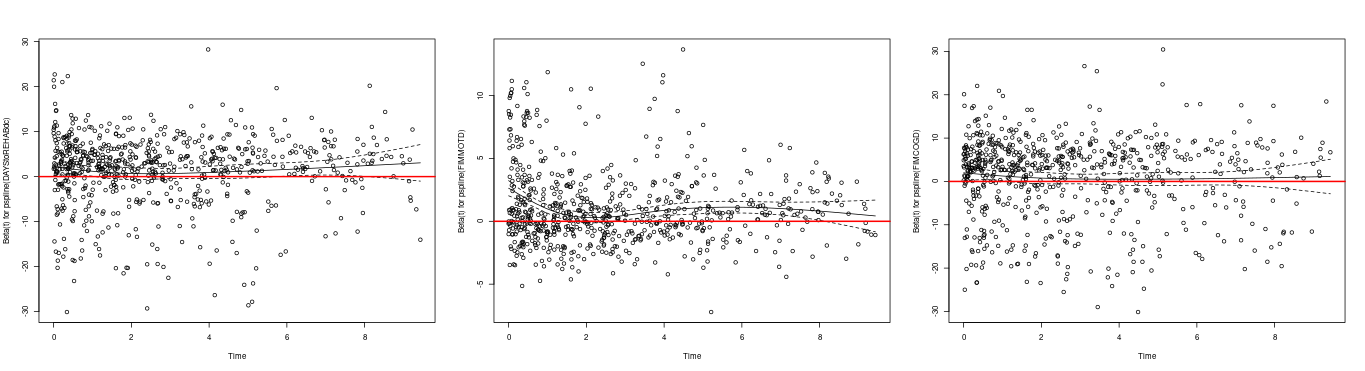
**Figure A12** caption
Notes:
- polynomials (A11) and splines (A12) appear to help stabilize residuals, but not enough
Interaction with time
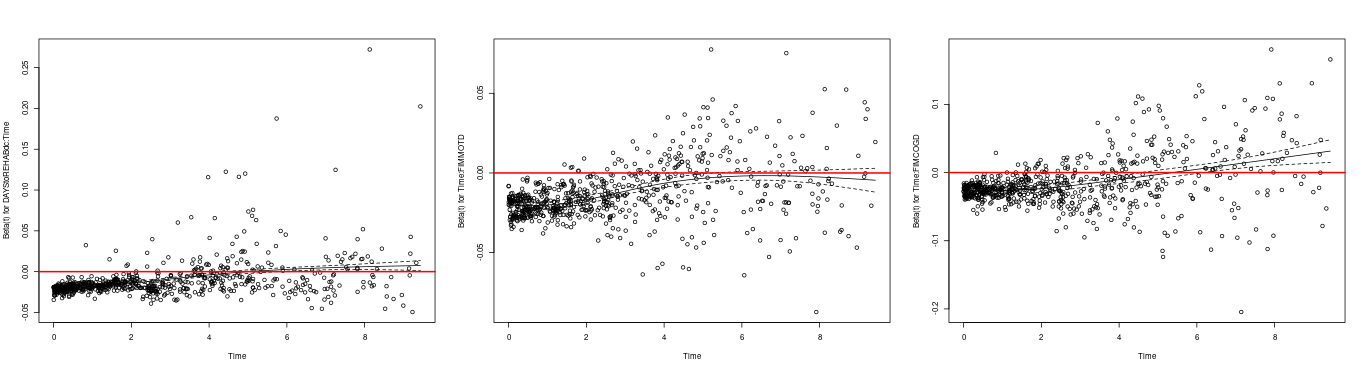
**Figure A13** caption
Notes:
- makes non-PH worse, not helpful at all (A13)
FIM scores quartiles
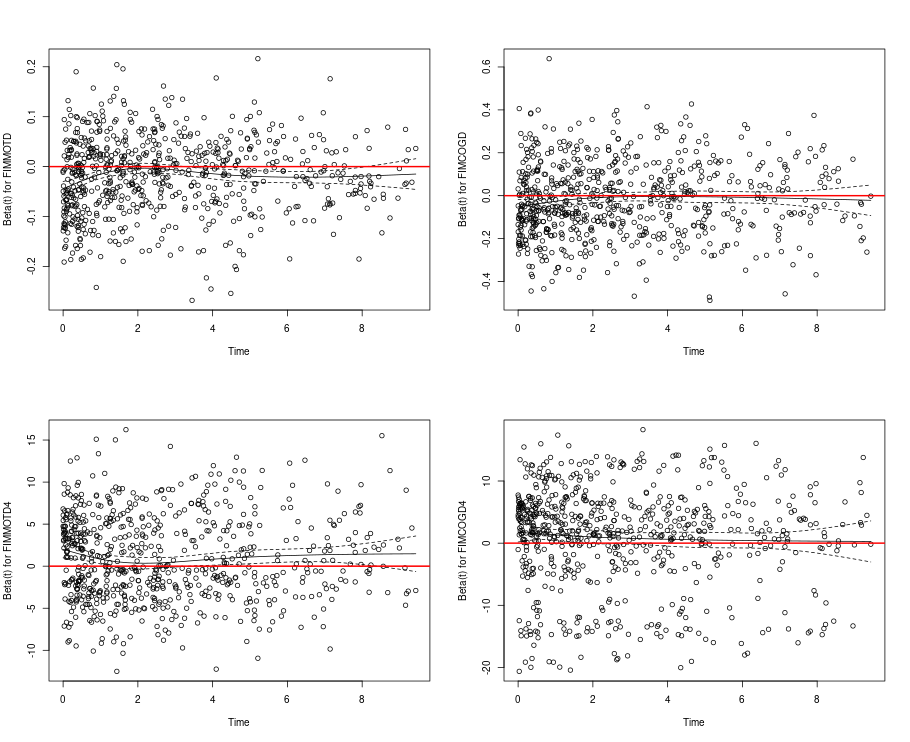
**Figure A14** caption
Notes:
- days still non-PH (A14)
- FIM scores seem PH enough (A14)
Best model specification
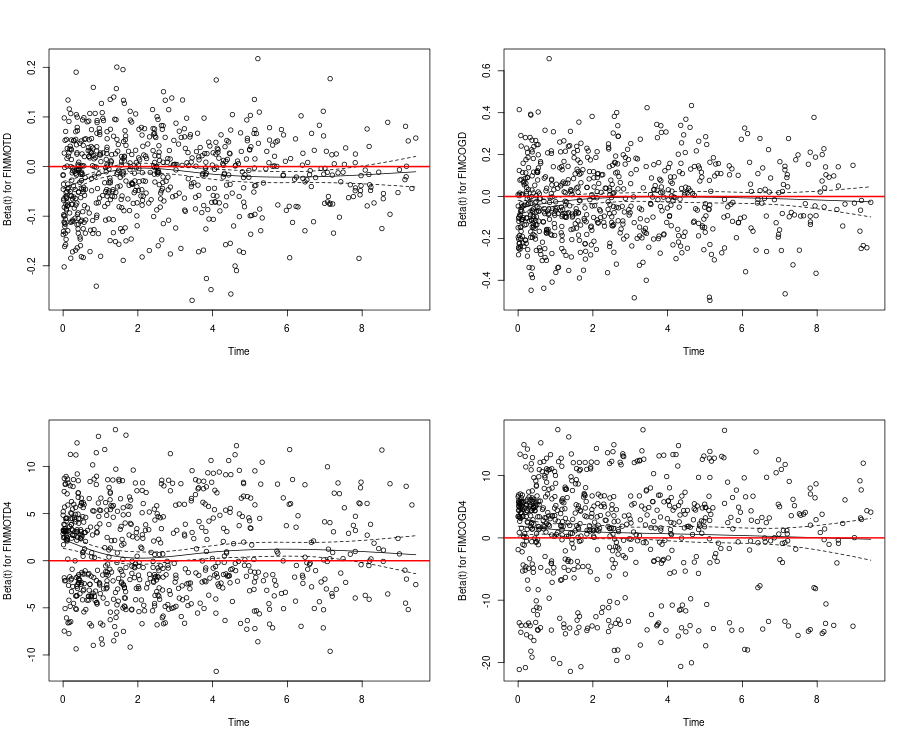
**Figure A15** caption
Notes:
- removing days makes residuals appear PH (A15)
- passes schoenfeld test
- final model: strat by cause + FIM quartiles + drop days
After location/SES imputation
Schoenfeld test
Table: Table A1 P-values of the Schoenfeld test for all 6 models.
| term | model1 | model2 | model3 | model4 | model5 | model6 |
|---|---|---|---|---|---|---|
| exposure | 0.062 | 0.6 | 0.7 | 0.6 | 0.5 | 0.6 |
| GLOBAL | 0.062 | 0.3 | 0.3 | 0.6 | 0.2 | 0.3 |
| SexF | NA | 0.051 | 0.12 | 0.2 | 0.2 | 0.13 |
| Race | NA | 0.12 | 0.12 | 0.2 | 0.3 | 0.3 |
| AGE | NA | 0.13 | 0.3 | 0.5 | 0.7 | 0.9 |
| EDUCATION | NA | >0.9 | >0.9 | 0.9 | >0.9 | >0.9 |
| EMPLOYMENT | NA | 0.072 | 0.10 | 0.2 | 0.3 | 0.3 |
| ResDis | NA | NA | 0.2 | 0.3 | 0.4 | 0.5 |
| RURALdc | NA | NA | 0.14 | 0.3 | 0.3 | 0.3 |
| RehabPay1 | NA | NA | NA | 0.5 | 0.6 | 0.6 |
| SCI | NA | NA | NA | 0.4 | 0.3 | 0.14 |
| PROBLEMUse | NA | NA | NA | 0.4 | 0.4 | 0.4 |
| DAYStoREHABdc | NA | NA | NA | 0.2 | 0.052 | 0.071 |
| FIMMOTD4 | NA | NA | NA | NA | 0.045 | 0.12 |
| FIMCOGD4 | NA | NA | NA | NA | 0.2 | 0.14 |
| exposure:FIMMOTD4 | NA | NA | NA | NA | NA | 0.088 |
| exposure:FIMCOGD4 | NA | NA | NA | NA | NA | 0.3 |
Final model specification
Table: Table A2 Alternative version of Table 2, showing the coefficients from all covariates included in all 6 models.
| Characteristic | HR (SE) | HR (SE) | HR (SE) | HR (SE) | HR (SE) | HR (SE) |
|---|---|---|---|---|---|---|
| SES quintiles | ||||||
| Prosperous | — | — | — | — | — | — |
| Comfortable | 1.16 (0.118) | 1.06 (0.118) | 0.97 (0.121) | 0.97 (0.121) | 0.97 (0.121) | 0.78 (0.216) |
| Mid-Tier | 0.98 (0.125) | 1.16 (0.126) | 1.12 (0.129) | 1.12 (0.129) | 1.08 (0.130) | 0.67 (0.242) |
| At-Risk | 1.28* (0.120) | 1.30* (0.121) | 1.19 (0.125) | 1.17 (0.125) | 1.10 (0.126) | 0.82 (0.225) |
| Distressed | 1.33* (0.116) | 1.37* (0.123) | 1.32* (0.126) | 1.30* (0.127) | 1.20 (0.127) | 1.04 (0.209) |
| Sex: | ||||||
| Male | — | — | — | — | — | |
| Female | 0.64*** (0.088) | 0.64*** (0.088) | 0.67*** (0.089) | 0.70*** (0.089) | 0.70*** (0.090) | |
| What is your race? | ||||||
| White | — | — | — | — | — | |
| Black | 0.83 (0.116) | 0.81 (0.119) | 0.81 (0.119) | 0.81 (0.120) | 0.81 (0.120) | |
| Hispanic | 0.64** (0.162) | 0.61** (0.167) | 0.61** (0.168) | 0.59** (0.168) | 0.56*** (0.169) | |
| Other | 0.73 (0.206) | 0.73 (0.207) | 0.72 (0.207) | 0.71 (0.208) | 0.68 (0.210) | |
| Age at Injury | 1.04*** (0.002) | 1.04*** (0.002) | 1.04*** (0.003) | 1.04*** (0.003) | 1.04*** (0.003) | |
| Education | ||||||
| Greater Than High School | — | — | — | — | — | |
| Less Than High School | 1.21 (0.114) | 1.25 (0.114) | 1.23 (0.115) | 1.17 (0.115) | 1.21 (0.117) | |
| High School/GED | 1.39*** (0.087) | 1.39*** (0.088) | 1.37*** (0.088) | 1.36*** (0.088) | 1.35*** (0.089) | |
| At time of injury, what was your employment status? | ||||||
| Employed | — | — | — | — | — | |
| Unemployed | 2.22*** (0.136) | 2.13*** (0.137) | 1.82*** (0.142) | 1.75*** (0.142) | 1.78*** (0.143) | |
| Other | 2.21*** (0.100) | 2.16*** (0.100) | 2.01*** (0.105) | 1.81*** (0.106) | 1.83*** (0.107) | |
| Residence after rehab discharge: | ||||||
| Private Residence | — | — | — | — | ||
| Other | 1.77*** (0.083) | 1.70*** (0.085) | 1.44*** (0.088) | 1.42*** (0.089) | ||
| Urbanization based on zip code of address at discharge. | ||||||
| Suburban | — | — | — | — | ||
| Rural | 1.00 (0.115) | 1.01 (0.115) | 1.03 (0.116) | 1.01 (0.117) | ||
| Urban | 1.13 (0.095) | 1.08 (0.096) | 1.13 (0.096) | 1.15 (0.097) | ||
| Primary rehabilitation payor: | ||||||
| Private Insurance | — | — | — | |||
| Public Insurance | 1.41*** (0.095) | 1.38*** (0.095) | 1.39*** (0.095) | |||
| Other | 1.16 (0.185) | 1.10 (0.185) | 1.09 (0.186) | |||
| Spinal cord injury: | 1.21 (0.175) | 1.29 (0.176) | 1.26 (0.178) | |||
| Substance Problem Use | 1.22* (0.093) | 1.27** (0.094) | 1.30** (0.095) | |||
| Days From Injury to Rehab Discharge | 1.00* (0.001) | 1.00 (0.001) | 1.00 (0.001) | |||
| FIM Motor at Discharge quartiles | ||||||
| Q1 | — | — | ||||
| Q2 | 0.67*** (0.102) | 0.56** (0.215) | ||||
| Q3 | 0.65*** (0.122) | 0.60* (0.247) | ||||
| Q4 | 0.55*** (0.143) | 0.17*** (0.379) | ||||
| FIM Cognitive at Discharge quartiles | ||||||
| Q1 | — | — | ||||
| Q2 | 0.84 (0.105) | 0.89 (0.219) | ||||
| Q3 | 0.81 (0.111) | 0.70 (0.253) | ||||
| Q4 | 0.64*** (0.128) | 0.65 (0.273) | ||||
| SES quintiles * FIM Motor at Discharge quartiles | ||||||
| Comfortable * Q2 | 1.53 (0.303) | |||||
| Mid-Tier * Q2 | 1.39 (0.331) | |||||
| At-Risk * Q2 | 1.20 (0.300) | |||||
| Distressed * Q2 | 0.98 (0.303) | |||||
| Comfortable * Q3 | 1.05 (0.366) | |||||
| Mid-Tier * Q3 | 1.15 (0.372) | |||||
| At-Risk * Q3 | 1.09 (0.358) | |||||
| Distressed * Q3 | 1.05 (0.338) | |||||
| Comfortable * Q4 | 5.19*** (0.467) | |||||
| Mid-Tier * Q4 | 3.59** (0.490) | |||||
| At-Risk * Q4 | 3.41** (0.475) | |||||
| Distressed * Q4 | 5.11*** (0.463) | |||||
| SES quintiles * FIM Cognitive at Discharge quartiles | ||||||
| Comfortable * Q2 | 0.97 (0.322) | |||||
| Mid-Tier * Q2 | 1.23 (0.343) | |||||
| At-Risk * Q2 | 0.86 (0.323) | |||||
| Distressed * Q2 | 0.79 (0.313) | |||||
| Comfortable * Q3 | 0.81 (0.361) | |||||
| Mid-Tier * Q3 | 2.12* (0.373) | |||||
| At-Risk * Q3 | 1.30 (0.342) | |||||
| Distressed * Q3 | 1.05 (0.342) | |||||
| Comfortable * Q4 | 0.76 (0.382) | |||||
| Mid-Tier * Q4 | 0.90 (0.427) | |||||
| At-Risk * Q4 | 1.88 (0.384) | |||||
| Distressed * Q4 | 0.93 (0.384) |
Availability
All documents from this consultation were included in the consultant’s Portfolio.
The portfolio is available at:
https://philsf-biostat.github.io/SAR-2023-016-BH/
Associated analyses
This analysis is part of a larger project and is supported by other analyses, linked below.
Effect of socioeconomic status in mortality rates after brain injury: cohort study
https://philsf-biostat.github.io/SAR-2023-004-BH/
Sensitivity of mortality rates to the imputation of missing socioeconomic data: cohort study
https://philsf-biostat.github.io/SAR-2023-017-BH/
Analytical dataset
Table A3 shows the structure of the analytical dataset.
| id | exposure | outcome | Time | SexF | Race | Mar | AGE | PROBLEMUse | EDUCATION | EMPLOYMENT | RURALdc | PriorSeiz | SCI | Cause | RehabPay1 | ResDis | DAYStoREHABdc | FIMMOTD | FIMCOGD | FollowUpPeriod | FIMMOTD4 | FIMCOGD4 | Mar2 | Mar3 |
|---|---|---|---|---|---|---|---|---|---|---|---|---|---|---|---|---|---|---|---|---|---|---|---|---|
| 1 | ||||||||||||||||||||||||
| 2 | ||||||||||||||||||||||||
| 3 | ||||||||||||||||||||||||
| … | ||||||||||||||||||||||||
| N |
Table: Table A3 Analytical dataset structure
Due to confidentiality the data-set used in this analysis cannot be shared online in the public version of this report.